Detecting Taps on Microsoft Band with RX and C#
This is a follow on to my original post on using RX with the Band to stream sensor information.
Using the RX streams and some maths to detect (roughly) when a user taps on the band. This allows you to send a notification to the band, for example, saying “I think your home, tap band to turn on your heating”.
Below is the result, I can really easily “await” tap or shake events! You can grab the code here and see how it all works below.
var stream = await band.GetShakeOrTapStream();
await stream.FirstAsync().ToTask();
So I started off by grabbed all the accelerometer data as CSV through the output window while tapping on the band.
accelSub = accStream
.Where(x=>x.SensorReading.AccelerationX != 0)
.Subscribe(x=>{
Debug.WriteLine("{0},{1},{2}", Math.Round(x.SensorReading.AccelerationX, rounding), Math.Round(x.SensorReading.AccelerationY, rounding), Math.Round(x.SensorReading.AccelerationZ, rounding));
});
Naively I thought the taps would be obvious to the human eye, they weren’t!
-0.093994,-0.691406,0.763672 -0.100098,-0.691895,0.760254 -0.099365,-0.677002,0.756348 -0.101807,-0.653564,0.746094 -0.105957,-0.640381,0.731934 -0.114014,-0.647949,0.733154 -0.106445,-0.656982,0.730225 -0.078857,-0.67627,0.730713 -0.063232,-0.686768,0.743652 -0.055176,-0.682129,0.765381 -0.040527,-0.676025,0.760986 -0.01709,-0.66626,0.751709 -0.001709,-0.64624,0.735352
So this is where I switched over to Excel to experiment with the data. The graph shed some light on what was going on.
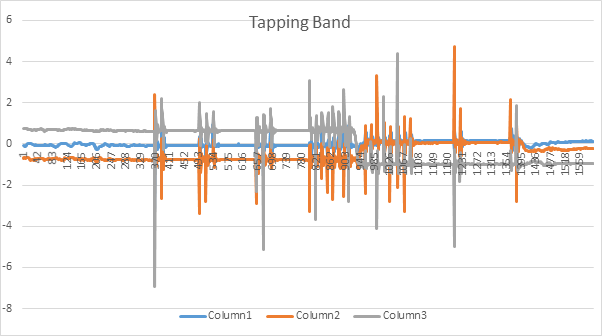
With this basic data you could see changes in the accelerometer data on all three Axis when a tap took place, looked good to me.
So what about normal motion follow by a tap, what does that look like? In the above I’m standing still and tapping the band but that’s not realistic for a user. So I simulated some normal motion, like walking and drinking water, then had a go at tapping the band. (I also did one hard tap while moving around).
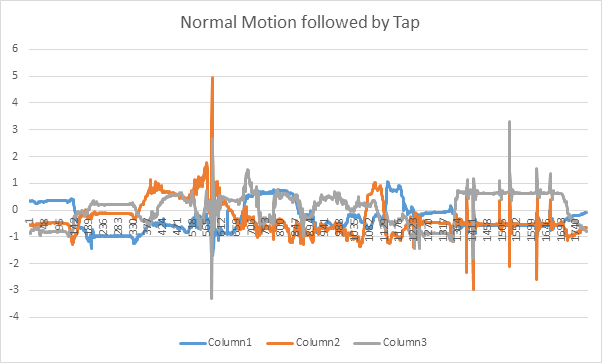
What you can see is that during normal motion there are a range of changes on all axis, they’re smoother and not strongly correlated. What I can see during taps is a high change on at least 2 axis.
To make these multi axis peaks easier to spot I summed all the motion on each axis and subtracted this value from the previous reading, to show the aggregate change between readings.
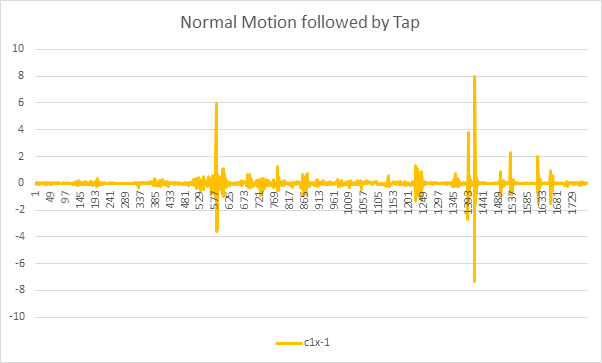
This appeared to clearly show the peaks where the taps occurred and successfully differentiate them from normal motion.
With the data in hand I started to make it into an algorithm which could run over the RX stream.
The scan operation gives me the ability to take input from the current and last event receive, it’s usually used to create aggregate values on the fly, however, I’m using it to compare the two readings and output the change between them. This gives me a RX stream with the output of the graph above.
Where the difference between the current and last reading was large I’d output that a tap event had occurred.
accelSub = accStream .Where(x=>x.SensorReading.AccelerationX != 0) .Select(x => { double[] array = { x.SensorReading.AccelerationX, x.SensorReading.AccelerationY, x.SensorReading.AccelerationZ }; //We're looking for taps so could come from any axis. Aggregate the reading to see! return array; } .Scan<double[], Tuple<double[], double>>(null, (last, current) => { if (last == null) { return new Tuple<double[], double>(current, 0); } var variation = (last.Item1[0] - current[0]) + (last.Item1[1] - current[1]) + (last.Item1[1] - current[1]); return new Tuple<double[], double>(current, variation); }) .Where(x=>x.Item2 > 4) .Subscribe(x => { Debug.WriteLine("Tap Detected" + x.Item1); });So this approach did the job, when stationary, tapping created a great result. Below you can see 5 distinct taps.
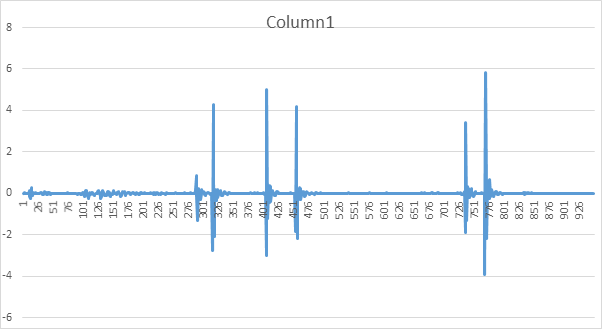
The problem was that, when moving around, we get some large aggregate motion readings with big changes between them due to sustained motion, like swinging your arm.
I need to look for short, sharp spikes for these to be taps or shakes. Rather than large gradual changes.
At this point I had an experiment with implementing a high pass filter over the data to detect the taps and shakes, unfortunately it didn’t work well during my tests. This is something I hope to come back to at some point.
Adding in a time based buffer for 400ms and then calculating the variance of the items capture within the buffer gave me a much cleaner reading. Row 27 shows a tap, the other peaks are me picking up water bottles, opening doors and generally trying to simulate normal movement.
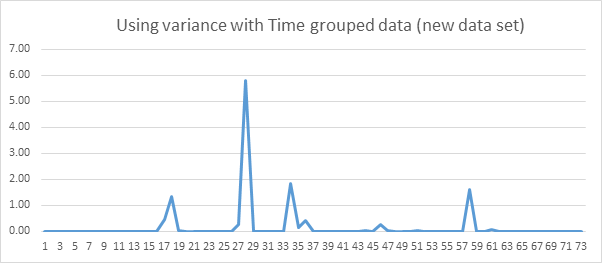
So with that added in we end up with this: